This data archive provides 1/16 degree resolution, daily-time-step, statistically-downscaled climate change scenarios for the State of Indiana, based on Global Climate Model (GMC) simulations from the Coupled Model Intercomparion Project phase 5 (CMIP5) associated with the IPCC Fifth Assessment Report on global climate change. The statistical downscaling uses the Hybrid Delta (HD) approach developed at the University of Washington (Tohver et al. 2014; Hamlet et al. 2013).
Byun, K., & Hamlet, A. F. (2018). Projected changes in future climate over the Midwest and Great Lakes region using downscaled CMIP5 ensembles. International Journal of Climatology, 38(Suppl.1), e531e553. https://doi.org/10.1002/joc.5388
Hamlet, A. F., Byun, K., Robeson, S. M., Widhalm, M., & Baldwin, M. (2019). Impacts of climate change on the state of Indiana: ensemble future projections based on statistical downscaling. Climatic Change, 115. https://doi.org/10.1007/s10584-018-2309-9
* This datasets is currently intended to support the Indiana Climate Change Impact Assessment (IN CCIA). Please contact the authors listed below for any other published work using this dataset.
The HD downscaling approach combines the strengths of the classic delta method (DM) approach with those from the Bias Correction and Spatial Disaggregation (BCSD) approach developed by Wood et al. [2004]. In particular, the downscaling retains the spatial and temporal characteristics of the observed meteorological data sets, but maps these patterns to the altered monthly statistics estimated by BCSD. Details on HD can be found in Tohver et al. (2014).
Our study uses monthly precipitation and near-surface (2m) air temperature data simulated by 31 GCMs from the CMIP5 archive. Data for one ensemble member (r1i1p1) were acquired from the Data Distribution Centre (DDC) of IPCC (http://www.ipcc-data.org/). For computational efficiency in projecting impacts for the IN CCIA, we selected 3 different groups (1 ensemble member, 6 ensemble members, 10 ensemble members) of GCM scenarios for this analysis, after analyzing simulated data from all 31 GCMs.
Our rationale for selecting these specific subsets of the larger ensemble is based on two fundamental criteria: (a) that the GCMs selected should represent the historical climate of the Midwest reasonably well (Fig. 1a) and (b) that the GCM scenarios selected in each group should span as well as possible the projected range of temperature and precipitation changes (delta T, delta P respectively) simulated by all 31 GCMs for each future time period and emissions scenario (Fig. 1b).
As shown for the RCP8.5 scenario in Fig. 1b, the group containing a single GCM is composed of the central tendency of the delta T/delta P space for the Midwest. The 6-GCM group is the center plus 5 GCMs spaced around the outer perimeter of the delta T/delta P space, and the 10-GCM group adds GCMs in between the central tendency and the outer ring to flesh out the middle of the ensemble. Also, all the GCMs in the three groups are ranked in the top half in terms of reproducing historical climate (satisfying criteria (a) above).
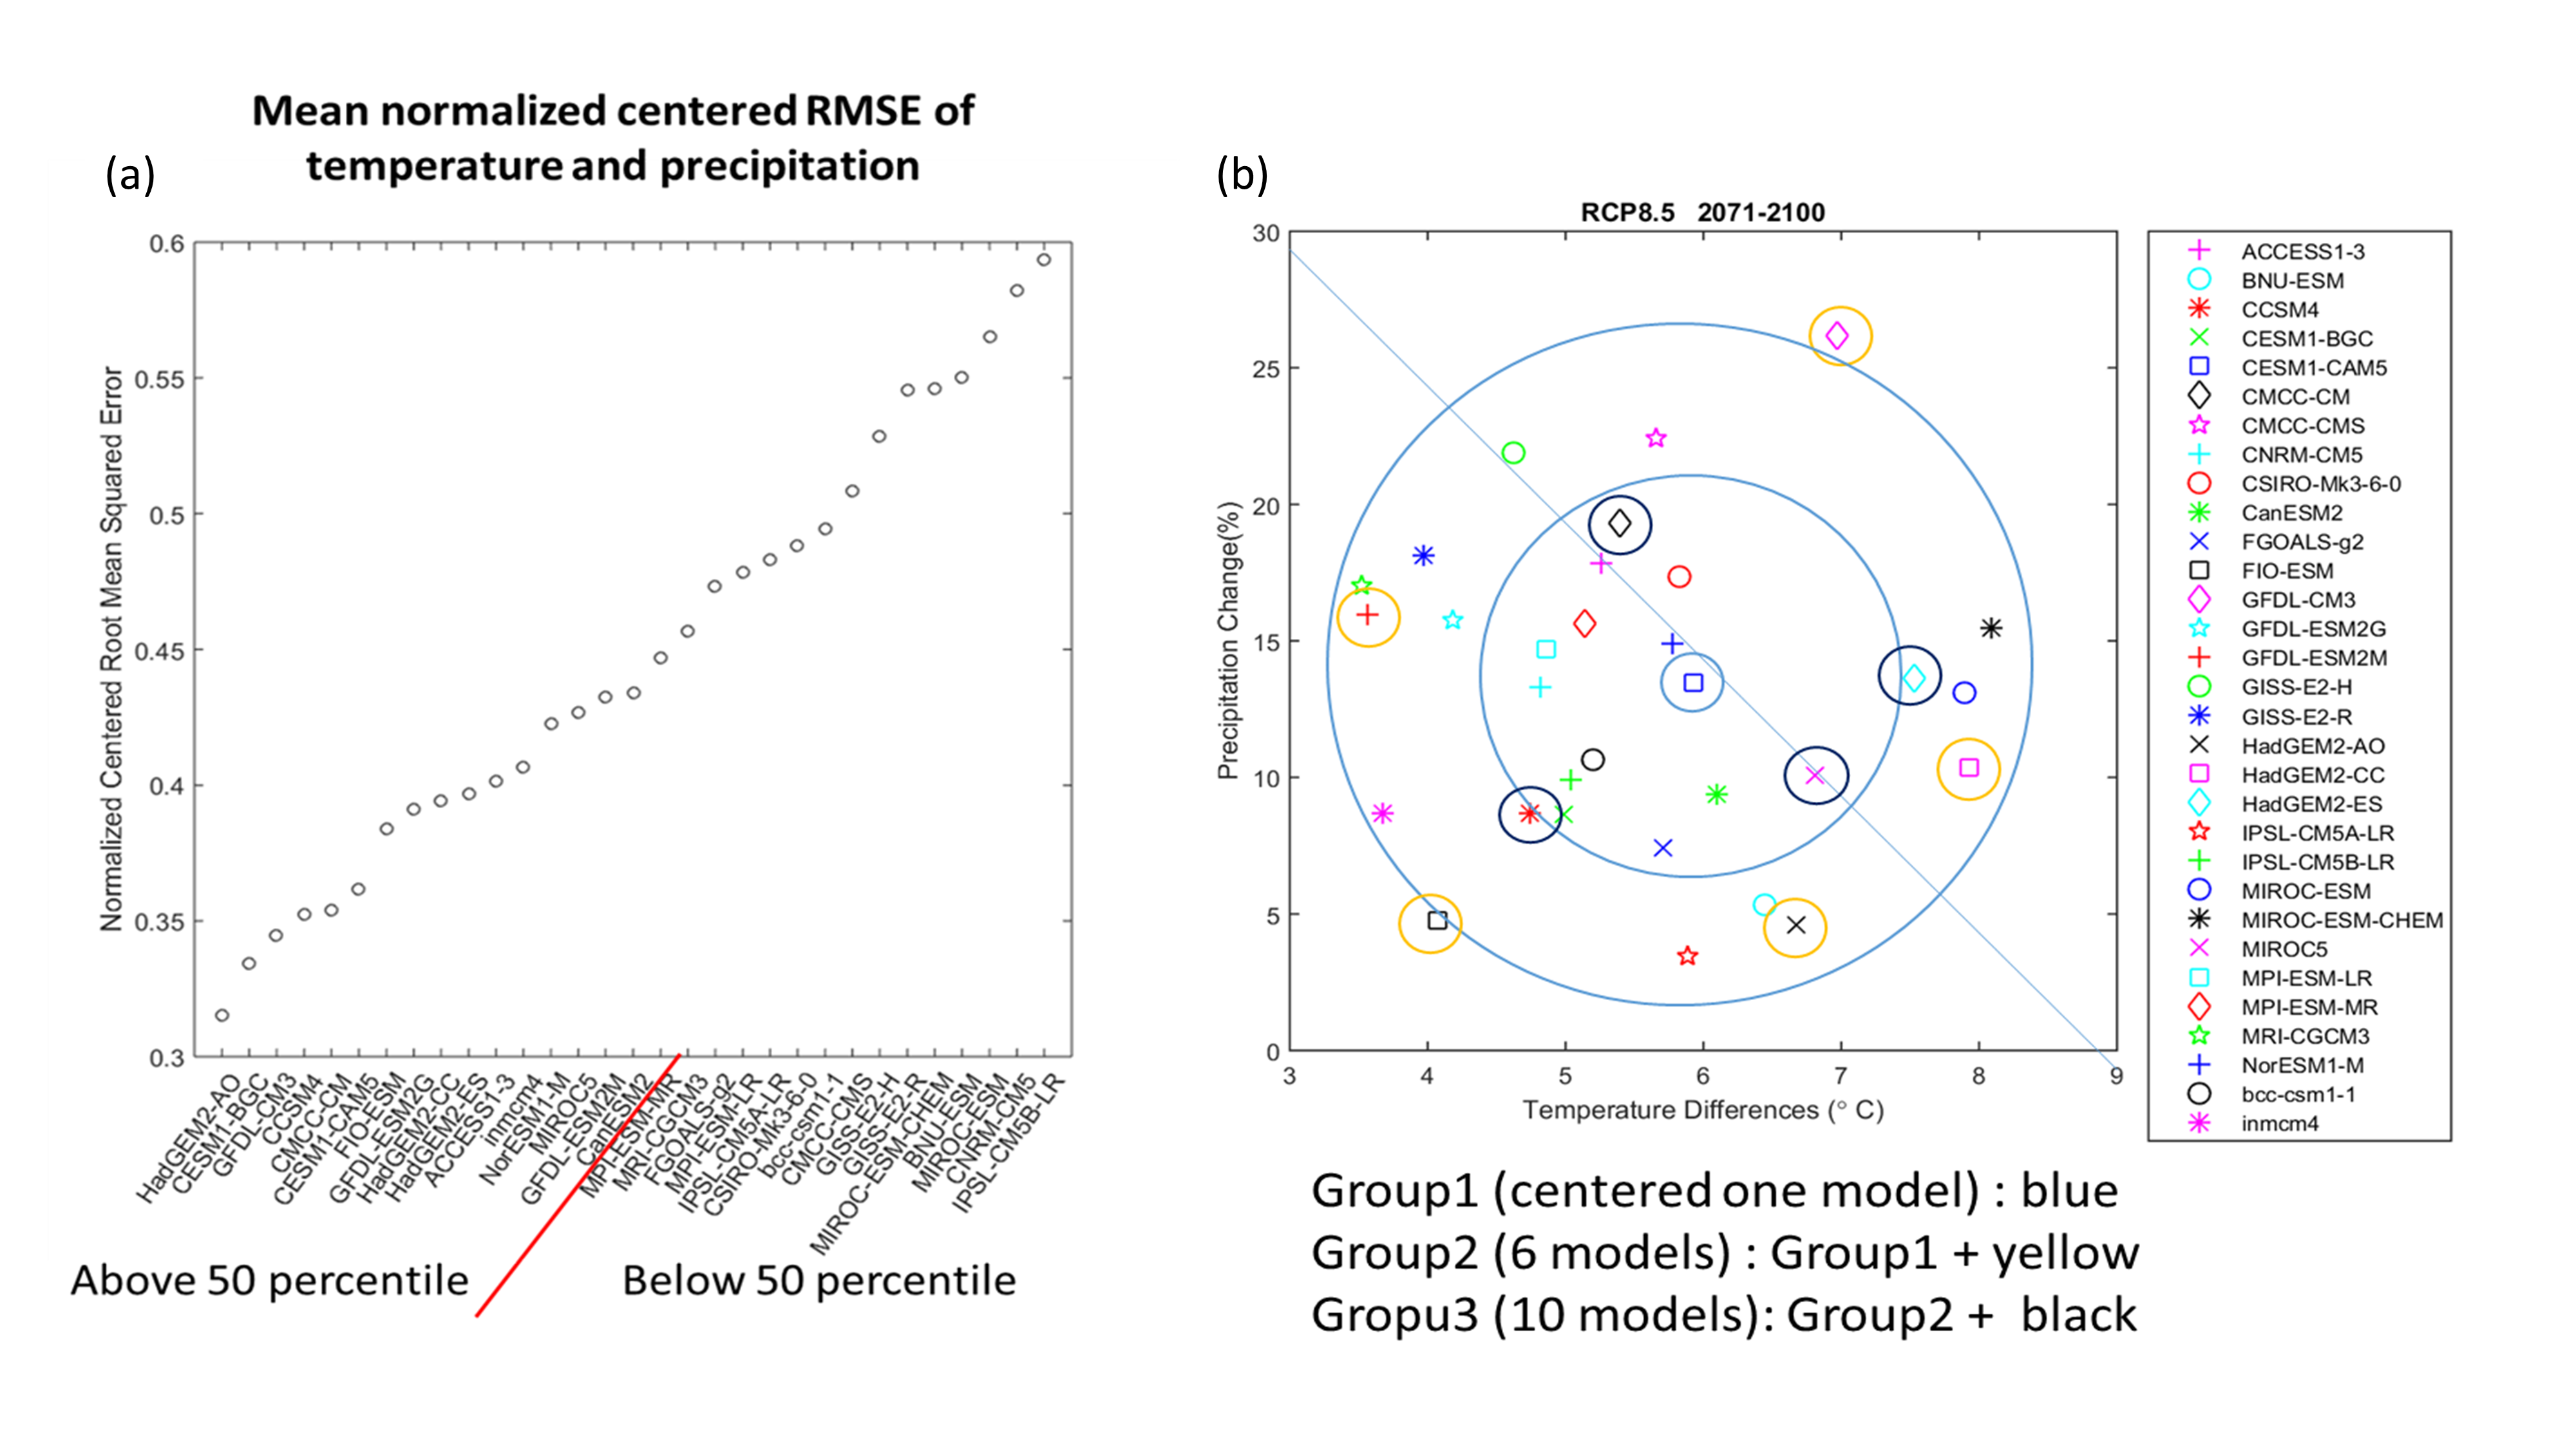
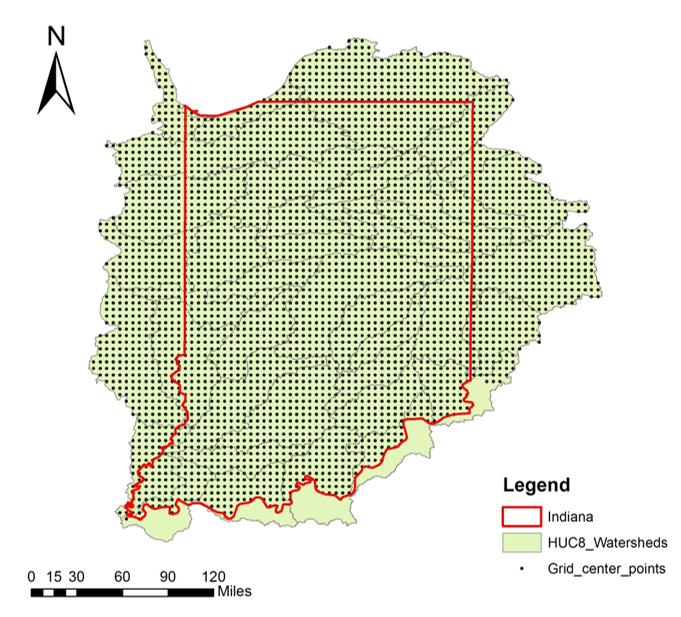
Figure 2 shows the spatial extent of the data set at 1/16 degree resolution covering the entire state of Indiana, as well as watershed areas that contribute flow to rivers in Indiana.
The format of this datasets is indentical with the input format for the VIC hydrologic model used at the University of Notre Dame and Purdue University. One file represents a 1/16 degree grid cell based on their center point location. The latitude and longitude of the center of each 1/16 degree grid cell are included (to five decimal point precision) in each file name.
The files are space-delimited text files with four fields (variables) per record (time step). The variable order in each record and units are:
Daily Precip (mm) Daily Tmax(Celsius degree) Daily Tmin (Celsius degree) Daily Wind Speed (m/s)
*******************************************************************************Note on Timestamp**********************************************************************************
According to intrinsic idea of HD, the size of projected daily times series for each future period is exactly the same with that of observed daily time series (1915-2013, 99-year, 36160 days) despite the fact that each future period is associated with a 30-year window from the future GCM projections. Thus, the timestamp for the time series of each future data is essentially the same with that of the observed data, and it can be considered as "Pseudo Timestamp". Please click the link below to download this timestamp that is universal for any future period data provided here.
To Download click here-> Timestamp
***************************************************************************************************************************************************************************************
Table 1 includes available downscaled GCMs based on different RCP emissions scenarios, and also three suggested groups of GCMs (Fig. 1b) are represented. You can download each GCM by clicking the model name in the active table below. Each file has been compressed in "zip" and contains three folders (Periods1, Periods2 and Periods3) based on three future periods.
Periods1: 2011-2040, Periods2: 2041-2070, Periods3: 2071-2100
The size of a GCM dataset:
Compressed File size: ~ 4 GB, Unzipped File size: ~ 12 GB
* You need to have at least 12 GB in your PC for a single GCM experiment.
Table 1. Downscaled GCM Datasets
| Suggested Groups of GCMs (# Models) | RCP 2.6 | RCP 4.5 | RCP 8.5 | ||
|---|---|---|---|---|---|
| Group1 (# 1) | Group2 (# 6) | Group3 (# 10) | CESM1-CAM5 | CESM1-CAM5 | CESM1-CAM5 |
| - | GFDL-CM3 | GFDL-CM3 | |||
| GFDL-ESM2M | GFDL-ESM2M | ||||
| FIO-ESM | FIO-ESM | ||||
| HadGEM2-AO | HadGEM2-AO | ||||
| HadGEM2-CC | HadGEM2-CC | ||||
| CCSM4 | CCSM4 | ||||
| CMCC-CM | CMCC-CM | ||||
| HadGEM2-ES | HadGEM2-ES | ||||
| MIROC5 | MIROC5 | ||||
Observed Dataset
Historically-observed daily meteorological data (1915-2013) over the Indiana State, which was used as baseline data for statistical downscaling of GCMs, can be downloaded by clicking here-> Observed
Questions regarding data usage or any other may be directed to:
Kyuhyun Byun (kbyun@nd.edu), PhD student
(Advisor: Dr. Alan F. Hamlet)
Dept. of Civil and Environmental Engineering and Earth Sciences,
University of Notre Dame, IN, United States
Hamlet, A.F., M.M. Elsner, G.S. Mauger, S-Y. Lee, I. Tohver, R.A. Norheim (2013): An Overview
of the Columbia Basin Climate Change Scenarios Project: Approach, Methods, and
Summary of Key Results, Atmosphere-Ocean, 51(4):392-415, doi:
10.1080/07055900.2013.819555.
Tohver, I. M., A. F. Hamlet, and S. Y. Lee (2014), Impacts of 21st-Century Climate Change on
Hydrologic Extremes in the Pacific Northwest Region of North America, J. Am. Water
Resour. Assoc., 50(6), 1461?476, doi:10.1111/jawr.12199.