
Efficiency


Transfer Protocol Summary
| Protocol | Stage-in Success | Stage-in Failure | Stageout Success | Stageout Failure |
|---|---|---|---|---|
| hdfs | 0 | 21559 | 0 | 9566 |
| root | 24265 | 0 | 9537 | 29 |
| Events | Units | |||||||||||||
|---|---|---|---|---|---|---|---|---|---|---|---|---|---|---|
| category | total | read | written | total |
unmasked
Units which are not masked by lumi_mask.
If no mask has been specified, all units are unmasked. For more information see the
documentation.
|
written | merged |
stuck
Units which cannot be attempted because they are either failed or skipped, or their input is
a unit in a parent workflow that failed or was skipped.
If you want to increase skipping/failure thresholds so that the parent units are attempted
again, run lobster configure /my/working/directory and increase
threshold_for_failure and/or threshold_for_skipping
in the lobster.core.config.AdvancedOptions section. If the parent unit
finishes successfully, the stuck units will automatically be attempted. For more information
see the documentation on
updating
your configuration after the start of a run, and advanced configuration
options.
|
failed
Units for which the executable has not exited successfully more than
threshold_for_failure.
If you want to increase the failure threshold so that these units are attempted again, run lobster configure /my/working/directory and increase threshold_for_failure in the lobster.core.config.AdvancedOptions section. For more information see the documentation on updating your configuration after the start of a run, and advanced configuration options. |
skipped
Units for which accessing the input file has failed more than
threshold_for_skipping.
If you want to increase the skipping threshold so that these units are attempted again, run lobster configure /my/working/directory and increase threshold_for_skipping in the lobster.core.config.AdvancedOptions section. For more information see the documentation on updating your configuration after the start of a run, and advanced configuration options. |
left
Units which are available for processing but haven't been attempted yet:
left = unmasked - running - written - failed - skipped - stuck |
Progress | Merged | JSON |
| mAOD_step_ttHJet_cptcptHanV4ttHjetAxisScanAxisScanqCut25_run0 | 0 | 267 163 | 267 163 | 1 600 | 1 600 | 1 600 | 1 600 | 0 | 0 | 0 | 0 | 100.0 % | 100.0 % | processed |
| mAOD_step_ttHJet_cptcptHanV4ttHjetAxisScanAxisScanqCut15_run0 | 0 | 268 468 | 268 468 | 1 600 | 1 600 | 1 600 | 1 600 | 0 | 0 | 0 | 0 | 100.0 % | 100.0 % | processed |
| mAOD_step_ttHJet_cptcptHanV4ttHjetAxisScanAxisScanqCut19_run0 | 0 | 268 165 | 268 165 | 1 600 | 1 600 | 1 600 | 1 600 | 0 | 0 | 0 | 0 | 100.0 % | 100.0 % | processed |
| mAOD_step_ttHJet_cptcptHanV4ttHjetAxisScanAxisScanqCut25_run1 | 0 | 259 828 | 259 828 | 1 600 | 1 600 | 1 600 | 1 600 | 0 | 0 | 0 | 0 | 100.0 % | 100.0 % | processed |
| mAOD_step_ttHJet_cptcptHanV4ttHjetAxisScanAxisScanqCut15_run1 | 0 | 259 377 | 259 377 | 1 600 | 1 600 | 1 600 | 1 600 | 0 | 0 | 0 | 0 | 100.0 % | 100.0 % | processed |
| mAOD_step_ttHJet_cptcptHanV4ttHjetAxisScanAxisScanqCut19_run1 | 0 | 259 913 | 259 913 | 1 600 | 1 600 | 1 600 | 1 600 | 0 | 0 | 0 | 0 | 100.0 % | 100.0 % | processed |
| mAOD_step_ttHJet_cptcptHanV4ttHjetAxisScanAxisScanqCut25_run2 | 0 | 257 451 | 257 451 | 1 600 | 1 600 | 1 599 | 1 599 | 1 | 0 | 0 | 0 | 99.9 % | 99.9 % | processed |
| mAOD_step_ttHJet_cptcptHanV4ttHjetAxisScanAxisScanqCut15_run2 | 0 | 256 348 | 256 348 | 1 600 | 1 600 | 1 600 | 1 600 | 0 | 0 | 0 | 0 | 100.0 % | 100.0 % | processed |
| mAOD_step_ttHJet_cptcptHanV4ttHjetAxisScanAxisScanqCut19_run2 | 0 | 257 138 | 257 138 | 1 600 | 1 600 | 1 600 | 1 600 | 0 | 0 | 0 | 0 | 100.0 % | 100.0 % | processed |
| mAOD_step_ttHJet_cptcptHanV4ttHjetAxisScanAxisScanqCut25_run3 | 0 | 260 345 | 260 345 | 1 600 | 1 600 | 1 600 | 1 600 | 0 | 0 | 0 | 0 | 100.0 % | 100.0 % | processed |
| mAOD_step_ttHJet_cptcptHanV4ttHjetAxisScanAxisScanqCut15_run3 | 0 | 260 251 | 260 251 | 1 600 | 1 600 | 1 600 | 1 600 | 0 | 0 | 0 | 0 | 100.0 % | 100.0 % | processed |
| mAOD_step_ttHJet_cptcptHanV4ttHjetAxisScanAxisScanqCut19_run3 | 0 | 260 665 | 260 665 | 1 600 | 1 600 | 1 599 | 1 599 | 1 | 0 | 0 | 0 | 99.9 % | 99.9 % | processed |
| mAOD_step_ttHJet_cptcptHanV4ttHjetAxisScanAxisScanqCut25_run4 | 0 | 266 768 | 266 768 | 1 600 | 1 600 | 1 600 | 1 600 | 0 | 0 | 0 | 0 | 100.0 % | 100.0 % | processed |
| mAOD_step_ttHJet_cptcptHanV4ttHjetAxisScanAxisScanqCut15_run4 | 0 | 268 762 | 268 762 | 1 600 | 1 600 | 1 600 | 1 600 | 0 | 0 | 0 | 0 | 100.0 % | 100.0 % | processed |
| mAOD_step_ttHJet_cptcptHanV4ttHjetAxisScanAxisScanqCut19_run4 | 0 | 269 557 | 269 557 | 1 600 | 1 600 | 1 600 | 1 600 | 0 | 0 | 0 | 0 | 100.0 % | 100.0 % | processed |
| Total | 0 | 3 940 199 | 3 940 199 | 24 000 | 24 000 | 23 998 | 23 998 | 2 | 0 | 0 | 0 | 100.0 % | 100.0 % | |

| Protocol | Stage-in Success | Stage-in Failure | Stageout Success | Stageout Failure |
|---|---|---|---|---|
| hdfs | 0 | 21559 | 0 | 9566 |
| root | 24265 | 0 | 9537 | 29 |


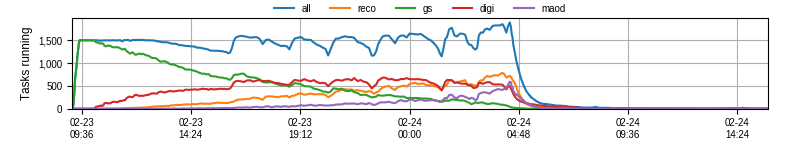
statisticsprofile show timeline breakdown


A mapping of the exit codes can be found in the documentation.


| Exit code | Count | Samples | |||||||||
|---|---|---|---|---|---|---|---|---|---|---|---|
| 143 | 3 | 50564 | 43940 | 40736 | |||||||
| Hostname | Exit Codes | |
|---|---|---|
| All | 143 | |
| q16copt093.crc.nd.edu | 1 | 1 |
| q16copt090.crc.nd.edu | 1 | 1 |
| q16copt088.crc.nd.edu | 1 | 1 |


