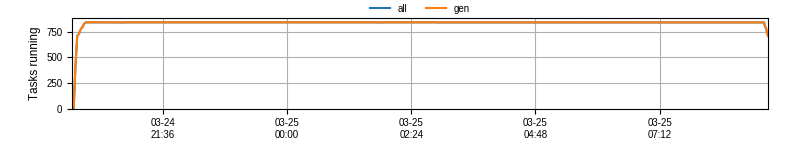

Efficiency


Transfer Protocol Summary
| Protocol | Stage-in Success | Stage-in Failure | Stageout Success | Stageout Failure |
|---|---|---|---|---|
| hdfs | 36176 | 0 | 36176 | 0 |
| Events | Units | |||||||||||||
|---|---|---|---|---|---|---|---|---|---|---|---|---|---|---|
| category | total | read | written | total |
unmasked
Units which are not masked by lumi_mask.
If no mask has been specified, all units are unmasked. For more information see the
documentation.
|
written | merged |
stuck
Units which cannot be attempted because they are either failed or skipped, or their input is
a unit in a parent workflow that failed or was skipped.
If you want to increase skipping/failure thresholds so that the parent units are attempted
again, run lobster configure /my/working/directory and increase
threshold_for_failure and/or threshold_for_skipping
in the lobster.core.config.AdvancedOptions section. If the parent unit
finishes successfully, the stuck units will automatically be attempted. For more information
see the documentation on
updating
your configuration after the start of a run, and advanced configuration
options.
|
failed
Units for which the executable has not exited successfully more than
threshold_for_failure.
If you want to increase the failure threshold so that these units are attempted again, run lobster configure /my/working/directory and increase threshold_for_failure in the lobster.core.config.AdvancedOptions section. For more information see the documentation on updating your configuration after the start of a run, and advanced configuration options. |
skipped
Units for which accessing the input file has failed more than
threshold_for_skipping.
If you want to increase the skipping threshold so that these units are attempted again, run lobster configure /my/working/directory and increase threshold_for_skipping in the lobster.core.config.AdvancedOptions section. For more information see the documentation on updating your configuration after the start of a run, and advanced configuration options. |
left
Units which are available for processing but haven't been attempted yet:
left = unmasked - running - written - failed - skipped - stuck |
Progress | Merged | JSON |
| gen_step_ttbarJet_cQq11check1Ddim6TopMay20GSTAxisScan_run0 | 0 | 356 000 | 130 782 | 820 | 820 | 712 | 0 | 0 | 0 | 0 | 0 | 86.8 % | 0.0 % | processed |
| gen_step_ttbarJet_cQq11check1Ddim6TopMay20GSTAxisScan_run1 | 0 | 410 000 | 127 533 | 820 | 820 | 820 | 0 | 0 | 0 | 0 | 0 | 100.0 % | 0.0 % | processed |
| gen_step_ttbarJet_cQq11check1Ddim6TopMay20GSTAxisScan_run2 | 0 | 397 500 | 145 970 | 820 | 820 | 795 | 0 | 0 | 0 | 0 | 0 | 97.0 % | 0.0 % | processed |
| gen_step_ttbarJet_cQq13check1Ddim6TopMay20GSTAxisScan_run0 | 0 | 407 500 | 128 008 | 820 | 820 | 815 | 0 | 0 | 0 | 0 | 0 | 99.4 % | 0.0 % | processed |
| gen_step_ttbarJet_cQq13check1Ddim6TopMay20GSTAxisScan_run1 | 0 | 395 000 | 123 338 | 820 | 820 | 790 | 0 | 0 | 0 | 0 | 0 | 96.3 % | 0.0 % | processed |
| gen_step_ttbarJet_cQq13check1Ddim6TopMay20GSTAxisScan_run2 | 0 | 406 000 | 128 077 | 820 | 820 | 812 | 0 | 0 | 0 | 0 | 0 | 99.0 % | 0.0 % | processed |
| gen_step_ttbarJet_cQq81check1Ddim6TopMay20GSTAxisScan_run0 | 0 | 410 000 | 128 476 | 820 | 820 | 820 | 0 | 0 | 0 | 0 | 0 | 100.0 % | 0.0 % | processed |
| gen_step_ttbarJet_cQq81check1Ddim6TopMay20GSTAxisScan_run1 | 0 | 407 500 | 127 006 | 820 | 820 | 815 | 0 | 0 | 0 | 0 | 0 | 99.4 % | 0.0 % | processed |
| gen_step_ttbarJet_cQq81check1Ddim6TopMay20GSTAxisScan_run2 | 0 | 400 000 | 128 627 | 820 | 820 | 800 | 0 | 0 | 0 | 0 | 0 | 97.6 % | 0.0 % | processed |
| gen_step_ttbarJet_cQq83check1Ddim6TopMay20GSTAxisScan_run0 | 0 | 410 000 | 128 180 | 820 | 820 | 820 | 0 | 0 | 0 | 0 | 0 | 100.0 % | 0.0 % | processed |
| gen_step_ttbarJet_cQq83check1Ddim6TopMay20GSTAxisScan_run1 | 0 | 409 000 | 127 897 | 820 | 820 | 818 | 0 | 0 | 0 | 0 | 0 | 99.8 % | 0.0 % | processed |
| gen_step_ttbarJet_cQq83check1Ddim6TopMay20GSTAxisScan_run2 | 0 | 410 000 | 128 583 | 820 | 820 | 820 | 0 | 0 | 0 | 0 | 0 | 100.0 % | 0.0 % | processed |
| gen_step_ttbarJet_cbWcheck1Ddim6TopMay20GSTAxisScan_run0 | 0 | 410 000 | 128 408 | 820 | 820 | 820 | 0 | 0 | 0 | 0 | 0 | 100.0 % | 0.0 % | processed |
| gen_step_ttbarJet_cbWcheck1Ddim6TopMay20GSTAxisScan_run1 | 0 | 408 500 | 127 622 | 820 | 820 | 817 | 0 | 0 | 0 | 0 | 0 | 99.6 % | 0.0 % | processed |
| gen_step_ttbarJet_cbWcheck1Ddim6TopMay20GSTAxisScan_run2 | 0 | 403 500 | 126 059 | 820 | 820 | 807 | 0 | 0 | 0 | 0 | 0 | 98.4 % | 0.0 % | processed |
| gen_step_ttbarJet_cpQ3check1Ddim6TopMay20GSTAxisScan_run0 | 0 | 409 500 | 127 877 | 820 | 820 | 819 | 0 | 0 | 0 | 0 | 0 | 99.9 % | 0.0 % | processed |
| gen_step_ttbarJet_cpQ3check1Ddim6TopMay20GSTAxisScan_run1 | 0 | 410 000 | 127 902 | 820 | 820 | 820 | 0 | 0 | 0 | 0 | 0 | 100.0 % | 0.0 % | processed |
| gen_step_ttbarJet_cpQ3check1Ddim6TopMay20GSTAxisScan_run2 | 0 | 410 000 | 128 118 | 820 | 820 | 820 | 0 | 0 | 0 | 0 | 0 | 100.0 % | 0.0 % | processed |
| gen_step_ttbarJet_cpQMcheck1Ddim6TopMay20GSTAxisScan_run0 | 0 | 410 000 | 126 743 | 820 | 820 | 820 | 0 | 0 | 0 | 0 | 0 | 100.0 % | 0.0 % | processed |
| gen_step_ttbarJet_cpQMcheck1Ddim6TopMay20GSTAxisScan_run1 | 0 | 389 500 | 121 818 | 820 | 820 | 779 | 0 | 0 | 0 | 0 | 0 | 95.0 % | 0.0 % | processed |
| gen_step_ttbarJet_cpQMcheck1Ddim6TopMay20GSTAxisScan_run2 | 0 | 410 000 | 128 052 | 820 | 820 | 820 | 0 | 0 | 0 | 0 | 0 | 100.0 % | 0.0 % | processed |
| gen_step_ttbarJet_cptbcheck1Ddim6TopMay20GSTAxisScan_run0 | 0 | 410 000 | 127 736 | 820 | 820 | 820 | 0 | 0 | 0 | 0 | 0 | 100.0 % | 0.0 % | processed |
| gen_step_ttbarJet_cptbcheck1Ddim6TopMay20GSTAxisScan_run1 | 0 | 409 000 | 127 462 | 820 | 820 | 818 | 0 | 0 | 0 | 0 | 0 | 99.8 % | 0.0 % | processed |
| gen_step_ttbarJet_cptbcheck1Ddim6TopMay20GSTAxisScan_run2 | 0 | 406 500 | 127 209 | 820 | 820 | 813 | 0 | 0 | 0 | 0 | 0 | 99.1 % | 0.0 % | processed |
| gen_step_ttbarJet_cptcheck1Ddim6TopMay20GSTAxisScan_run0 | 0 | 410 000 | 128 126 | 820 | 820 | 820 | 0 | 0 | 0 | 0 | 0 | 100.0 % | 0.0 % | processed |
| gen_step_ttbarJet_cptcheck1Ddim6TopMay20GSTAxisScan_run1 | 0 | 410 000 | 128 025 | 820 | 820 | 820 | 0 | 0 | 0 | 0 | 0 | 100.0 % | 0.0 % | processed |
| gen_step_ttbarJet_cptcheck1Ddim6TopMay20GSTAxisScan_run2 | 0 | 375 000 | 116 452 | 820 | 820 | 750 | 0 | 0 | 0 | 0 | 0 | 91.5 % | 0.0 % | processed |
| gen_step_ttbarJet_ctGcheck1Ddim6TopMay20GSTAxisScan_run0 | 0 | 410 000 | 128 318 | 820 | 820 | 820 | 0 | 0 | 0 | 0 | 0 | 100.0 % | 0.0 % | processed |
| gen_step_ttbarJet_ctGcheck1Ddim6TopMay20GSTAxisScan_run1 | 0 | 410 000 | 127 775 | 820 | 820 | 820 | 0 | 0 | 0 | 0 | 0 | 100.0 % | 0.0 % | processed |
| gen_step_ttbarJet_ctGcheck1Ddim6TopMay20GSTAxisScan_run2 | 0 | 393 000 | 121 028 | 820 | 820 | 786 | 0 | 0 | 0 | 0 | 0 | 95.9 % | 0.0 % | processed |
| gen_step_ttbarJet_ctWcheck1Ddim6TopMay20GSTAxisScan_run0 | 0 | 370 500 | 116 244 | 820 | 820 | 741 | 0 | 0 | 0 | 0 | 0 | 90.4 % | 0.0 % | processed |
| gen_step_ttbarJet_ctWcheck1Ddim6TopMay20GSTAxisScan_run1 | 0 | 401 500 | 125 246 | 820 | 820 | 803 | 0 | 0 | 0 | 0 | 0 | 97.9 % | 0.0 % | processed |
| gen_step_ttbarJet_ctWcheck1Ddim6TopMay20GSTAxisScan_run2 | 0 | 408 500 | 128 317 | 820 | 820 | 817 | 0 | 0 | 0 | 0 | 0 | 99.6 % | 0.0 % | processed |
| gen_step_ttbarJet_ctZcheck1Ddim6TopMay20GSTAxisScan_run0 | 0 | 408 500 | 128 537 | 820 | 820 | 817 | 0 | 0 | 0 | 0 | 0 | 99.6 % | 0.0 % | processed |
| gen_step_ttbarJet_ctZcheck1Ddim6TopMay20GSTAxisScan_run1 | 0 | 410 000 | 128 233 | 820 | 820 | 820 | 0 | 0 | 0 | 0 | 0 | 100.0 % | 0.0 % | processed |
| gen_step_ttbarJet_ctZcheck1Ddim6TopMay20GSTAxisScan_run2 | 0 | 381 500 | 119 480 | 820 | 820 | 763 | 0 | 0 | 0 | 0 | 0 | 93.0 % | 0.0 % | processed |
| gen_step_ttbarJet_ctpcheck1Ddim6TopMay20GSTAxisScan_run0 | 0 | 410 000 | 127 992 | 820 | 820 | 820 | 0 | 0 | 0 | 0 | 0 | 100.0 % | 0.0 % | processed |
| gen_step_ttbarJet_ctpcheck1Ddim6TopMay20GSTAxisScan_run1 | 0 | 404 000 | 126 233 | 820 | 820 | 808 | 0 | 0 | 0 | 0 | 0 | 98.5 % | 0.0 % | processed |
| gen_step_ttbarJet_ctpcheck1Ddim6TopMay20GSTAxisScan_run2 | 0 | 361 000 | 112 415 | 820 | 820 | 722 | 0 | 0 | 0 | 0 | 0 | 88.0 % | 0.0 % | processed |
| gen_step_ttbarJet_ctq1check1Ddim6TopMay20GSTAxisScan_run0 | 0 | 410 000 | 142 265 | 820 | 820 | 820 | 0 | 0 | 0 | 0 | 0 | 100.0 % | 0.0 % | processed |
| gen_step_ttbarJet_ctq1check1Ddim6TopMay20GSTAxisScan_run1 | 0 | 410 000 | 127 891 | 820 | 820 | 820 | 0 | 0 | 0 | 0 | 0 | 100.0 % | 0.0 % | processed |
| gen_step_ttbarJet_ctq1check1Ddim6TopMay20GSTAxisScan_run2 | 0 | 409 000 | 142 445 | 820 | 820 | 818 | 0 | 0 | 0 | 0 | 0 | 99.8 % | 0.0 % | processed |
| gen_step_ttbarJet_ctq8check1Ddim6TopMay20GSTAxisScan_run0 | 0 | 410 000 | 127 832 | 820 | 820 | 820 | 0 | 0 | 0 | 0 | 0 | 100.0 % | 0.0 % | processed |
| gen_step_ttbarJet_ctq8check1Ddim6TopMay20GSTAxisScan_run1 | 0 | 386 000 | 120 440 | 820 | 820 | 772 | 0 | 0 | 0 | 0 | 0 | 94.1 % | 0.0 % | processed |
| gen_step_ttbarJet_ctq8check1Ddim6TopMay20GSTAxisScan_run2 | 0 | 403 000 | 129 041 | 820 | 820 | 806 | 0 | 0 | 0 | 0 | 0 | 98.3 % | 0.0 % | processed |
| Total | 0 | 18 096 500 | 5 729 818 | 36 900 | 36 900 | 36 193 | 0 | 0 | 0 | 0 | 0 | 98.1 % | 0.0 % | |

| Protocol | Stage-in Success | Stage-in Failure | Stageout Success | Stageout Failure |
|---|---|---|---|---|
| hdfs | 36176 | 0 | 36176 | 0 |


statisticsprofile show timeline breakdown
No successful merge tasks yet!
No failed tasks yet!


